Science Behind Visual Perception in 3D Vector Maps
In an age where data visualization is central to design, planning, and decision-making, 3D vector maps have become powerful tools for spatial understanding. From urban planning to interactive architecture illustration, these maps combine aesthetics with data science to create deeply informative visual experiences. But what makes them so effective? The answer lies in the science of visual perception—how the human brain interprets spatial cues, depth, motion, and color in 3D environments.
Understanding 3D Vector Maps: A Quick Overview
Before diving into the science of visual perception, let’s clarify what 3D vector maps are.
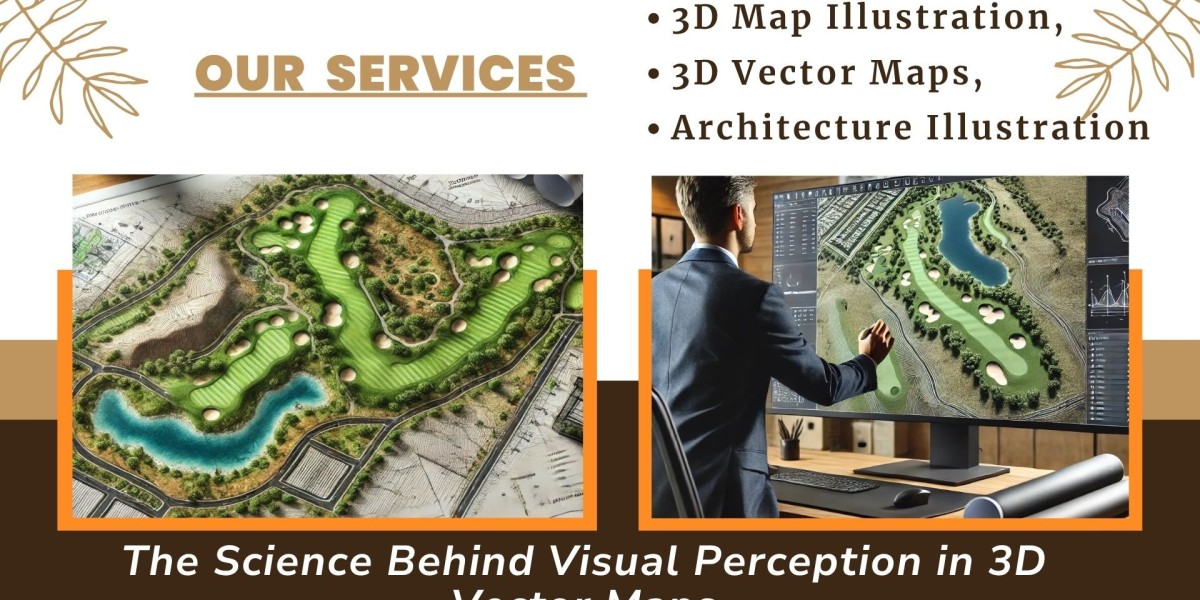
Unlike raster-based maps that rely on pixels, 3D vector maps use geometric shapes—points, lines, and polygons—to represent spatial data. When combined with elevation data and advanced rendering techniques, these maps create realistic yet scalable 3D environments. A 3D Map Illustration of a city, for example, can showcase building heights, terrain contours, roads, and even underground structures, all in one comprehensive layout.
Architects, urban planners, and designers frequently use these maps as part of Architecture Illustration to present development plans, site analyses, and spatial simulations.
The Role of Visual Perception in 3D Map Interpretation
Several scientific principles guide how we perceive 3D visuals, and when used correctly in 3D Map Illustration, they enhance clarity, engagement, and utility.
Let’s explore the major components of this science:
1. Depth Perception and Perspective Cues
Humans perceive depth using monocular cues (like shadows, texture gradients, and perspective) and binocular cues (like stereopsis).
For instance, a map showing a proposed stadium in a city center can use gradient shading and vanishing points to give a sense of scale and positioning.
2. Color Theory and Layer Differentiation
Color is not just aesthetic; it’s functional. In the context of 3D Vector Maps, color helps users distinguish between different types of data—residential zones, commercial areas, vegetation, water bodies, etc.
Designers use warm colors (reds, yellows) to highlight features or areas of urgency, and cool colors (blues, greens) for background or non-critical regions. This contrast guides the viewer’s attention naturally.
Moreover, color gradients help illustrate elevation changes, water depth, or land use intensity. When combined with proper Architecture Illustration techniques, color becomes an intuitive guide through a complex 3D environment.
3. Motion Parallax in Interactive Maps
This movement introduces an important cue called motion parallax—objects closer to the viewer move faster than distant objects, mimicking real-world vision.
This feature helps users understand spatial relationships and navigate virtual environments more intuitively. In architecture, a rotating 3D map illustration can show how a new building casts shadows at different times of the day or how its massing affects nearby structures.
4. Gestalt Principles in Spatial Grouping
Gestalt psychology offers a set of principles explaining how humans perceive visual groups and patterns.
- Similarity: Buildings with the same function (like schools or hospitals) are grouped with similar icons or colors.
- Proximity: Closely spaced objects are perceived as related.
By leveraging these principles, designers can reduce clutter and help users focus on what's most important in a 3D map interface.
5. Visual Hierarchy and Cognitive Load
Good design organizes information by importance—a concept known as visual hierarchy. In 3D vector maps, this is achieved by manipulating size, brightness, contrast, and placement.
Important landmarks may be rendered larger or in bolder colors, while less critical features fade into the background. This mirrors how the brain naturally filters visual input—what stands out gets attention.
Additionally, minimizing cognitive load (mental effort to understand a visual) is crucial. A clean and intuitive 3D Map Illustration allows users to grasp complex spatial data quickly without feeling overwhelmed.
Neuroscience and Attention in 3D Map Design
Recent neuroscience research supports these design principles. The human brain has specialized regions like the parietal lobe, which processes spatial orientation, and the visual cortex, which interprets patterns, edges, and motion.
Studies using fMRI scans have shown that interactive, well-structured 3D environments activate these areas more effectively than static 2D layouts. This suggests that 3D Vector Maps not only look better—they literally engage the brain more efficiently, leading to better retention and understanding.
This makes them ideal for architecture illustration, where clients or stakeholders need to grasp spatial relationships and design intent in a short time.
Practical Applications: Why This Science Matters
Urban Planning and Zoning
City planners use 3D map illustrations to visualize new developments, evaluate land use, and forecast population density impacts. The visual perception techniques mentioned above ensure these maps are not just accurate but also accessible to non-technical audiences.
Architecture and Construction
An Architecture Illustration showing a building's relationship to surrounding structures, road access, and topography becomes far more persuasive when rendered as a 3D vector map. Stakeholders can “see” the design rather than imagine it.
Tourism and Navigation
Interactive 3D vector maps of tourist destinations provide immersive previews. By simulating real-world depth and texture, they enhance wayfinding and user engagement, critical for digital tourism platforms.
Future Trends: AI and Eye-Tracking in Map Optimization
Emerging technologies like eye-tracking and AI-powered UX optimization are refining how 3D Vector Maps are designed. By tracking where users look and for how long, designers can adjust elements to better align with natural visual patterns.
In the near future, we might see adaptive 3D map illustrations that change based on user behavior, offering personalized layers of information or dynamically adjusting visual hierarchy in real time.
Conclusion
The effectiveness of 3D vector maps lies not just in their technical sophistication but in how well they align with the human brain's natural way of seeing and understanding the world. By grounding design in the science of visual perception—through depth cues, color theory, motion, and cognitive psychology—these maps become powerful tools for storytelling, communication, and decision-making.
Whether you're creating an Architecture Illustration for a new high-rise, a zoning proposal for city planners, or an interactive tourism guide, understanding the visual science behind 3D Map Illustration ensures your message is not just seen—but deeply understood.


